将Ti用金刚石砂纸(No. 600-2000)抛光并用乙醇、丙酮和蒸馏水清洗(各 15 分钟)后,首先用5 M NaOH溶液在80°C下蚀刻24小时,得到样品表示为 AT。为了调节Na和Mg之间的交换反应,将AT底物浸入盐酸 (HCl, 0.05 M)中30分钟,然后浸入 Mg (NO3)2·6H2O (0.05 M) 溶液中30分钟。接下来,在高压反应器下,将 Mg 交换的基材浸泡在已制备好的各种37 mL 液体中。在 125 ℃下加热 24 h 后,收集不同样品并在超声条件下(300 W,40 KHz,每次 30 s)用蒸馏水清洗 5 次。根据Zn添加量的差异将构建的样品分别表示为AT-Mg、AT-Mg/Zn1、AT-Mg/Zn2、AT-Mg/Zn3、AT-Mg/Zn4和AT-Mg/Zn5。表面形态、涂层厚度和化学成分分别通过扫描电子显微镜和能谱仪(SEM 和 EDS,Zeiss AURIGA FIB,德国)进行表征。
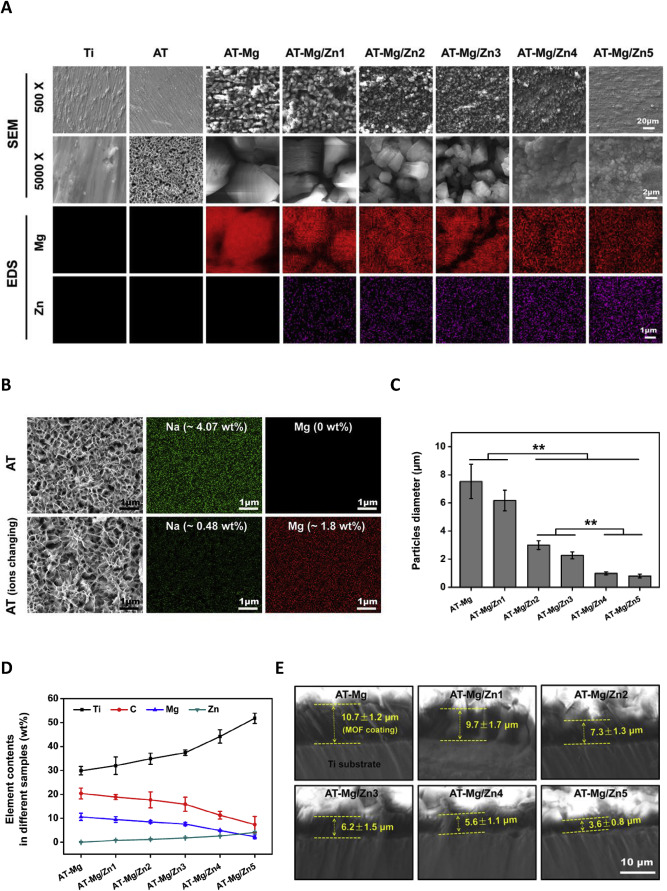
从SEM结果(图1A),Ti和AT表面显示出粗糙的表面形态,带有一些划痕。经或未经HCl和Mg(NO3)2·6H2O溶液处理的AT底物的高倍放大成像显示海绵状纳米结构(图 1A 和B)。用各种 Mg/Zn-MOF74 材料涂覆后,基材的表面形貌呈现出一些颗粒层,其粒径从 AT-Mg 到 AT-Mg/Zn5 逐渐减小。此外,AT-Mg、AT-Mg/Zn1、AT-Mg/Zn2、AT-Mg/Zn3、AT-Mg/Zn4 和 AT-Mg/Zn5 组的粒径分别约为 7.5、6.2、3.0、2.3、1.0 和 0.8μm(图 1C)。
EDS 分析检测不同基材表面的化学成分进一步证明了SEM的结果。 Mg/Zn-MOF74 涂层基底的 EDS 分析显示了 Mg 和 Zn 的信号(图 1A)。进一步研究表明,Ti和Zn的含量逐渐增加,而C和Mg减少(从 AT-Mg 到 AT-Mg/Zn5)(图 1D)。该结果表明,随着初始 Zn2+ 添加量的增加,Mg/Zn-MOF74 涂层的厚度逐渐减小。不同 Mg/Zn-MOF74 改性样品的截面SEM图像进一步证实了这一点(图 1E)。 AT-Mg、AT-Mg/Zn1、AT-Mg/Zn2、AT-Mg/Zn3、AT-Mg/Zn4和AT-Mg/Zn5的涂层厚度分别约为10.7±1.2、9.7±1.7、7.3±1.3.、6.2 ± 1.5、5.6 ± 1.1 和 3.6 ± 0.8 μm。此外,AT 样品在用 HCl和Mg(NO3)2·6H2O 浸泡前后的元素变化如图 1B 所示。在正常和Mg 替代的AT组中分别检测到约4.07和0.48 wt% 的 Na,仅在后者组中检测到Mg(~1.8 wt%)。
After polishing Ti with diamond sandpaper (No. 600-2000) and cleaning with ethanol, acetone and distilled water (15 minutes each), first etch it with 5 M NaOH solution at 80°C for 24 hours, and the sample obtained is denoted as AT. To adjust the exchange reaction between Na and Mg, the AT substrate was immersed in hydrochloric acid (HCl, 0.05 M) for 30 minutes, and then immersed in Mg (NO3)2·6H2O (0.05 M) solution for 30 minutes. Next, under the high-pressure reactor, the Mg-exchanged substrate was immersed in various 37 mL liquids that had been prepared. After heating at 125 ℃ for 24 h, different samples were collected and washed 5 times with distilled water under ultrasonic conditions (300 W, 40 KHz, 30 s each time). According to the difference in the amount of Zn added, the constructed samples were expressed as AT-Mg, AT-Mg/Zn1, AT-Mg/Zn2, AT-Mg/Zn3, AT-Mg/Zn4, and AT-Mg/Zn5. Surface morphology, coating thickness, and chemical composition were characterized by scanning electron microscopy and energy dispersive spectrometry (SEM & EDS, Zeiss AURIGA FIB, Germany), respectively. Surface crystalline phase and water contact angle was measured by X-ray diffraction (D/Max 2500 PC, Rigaku, Japan) and a video-based optical system (Model 200, Future Scientific, Taiwan, China), respectively. Simulated patterns of Mg MOF74 (CCDC 668974) and Zn-MOF74 (CCDC 1494750) were obtained with Materials Studio (Version 5.2). Coating adhesion strength of AT-Mg/Zn3 sample was measured by a scratch tester (CSM Instruments, Switzerland).
From SEM results (Fig. 1A), Ti and AT surfaces displayed rough surface morphology with some scratches. Higher magnification imaging of AT substrates with or without treatment by HCl and Mg(NO3)2·6H2O solution displayed spongy nanostructures (Fig. 1A and B). After coating with various Mg/Zn-MOF74 materials, the surface morphology of substrates displayed some granular layers and their particle size gradually decreased from AT-Mg to AT-Mg/Zn5. Moreover, the particle diameters of AT-Mg, AT-Mg/Zn1, AT-Mg/Zn2, AT-Mg/Zn3, AT-Mg/Zn4 and AT-Mg/Zn5 groups were approximately 7.5, 6.2, 3.0, 2.3, 1.0 and 0.8μm, respectively (Fig. 1C).
EDS analysis to detect the chemical composition of the surface of different substrates further proves the results of SEM.EDS analysis of Mg/Zn-MOF74-coated substrates showed signals of Mg and Zn (Fig. 1A). Further investigation revealed that the contents of Ti and Zn were gradually increased while C and Mg decreased (from AT-Mg to AT-Mg/Zn5) (Fig. 1D). This result demonstrated that the thickness of the Mg/Zn-MOF74 coatings gradually decreased with the increase of initial Zn2+ addition. It was further verified by the sectional SEM images of different Mg/Zn-MOF74-modified samples (Fig. 1E). The coating thicknesses of AT-Mg, AT-Mg/Zn1, AT-Mg/Zn2, AT-Mg/Zn3, AT-Mg/Zn4, and AT-Mg/Zn5 were approximately 10.7 ± 1.2, 9.7 ± 1.7, 7.3 ± 1.3., 6.2 ± 1.5, 5.6 ± 1.1, and 3.6 ± 0.8 μm, respectively. In addition, the element changes of AT samples before and after soaking with HCl and Mg(NO3)2·6H2O were showed in Fig. 1B. About 4.07 and 0.48 wt% of Na was respectively detected in normal and Mg-replaced AT groups, and Mg (∼1.8 wt%) was only detected in the latter group.