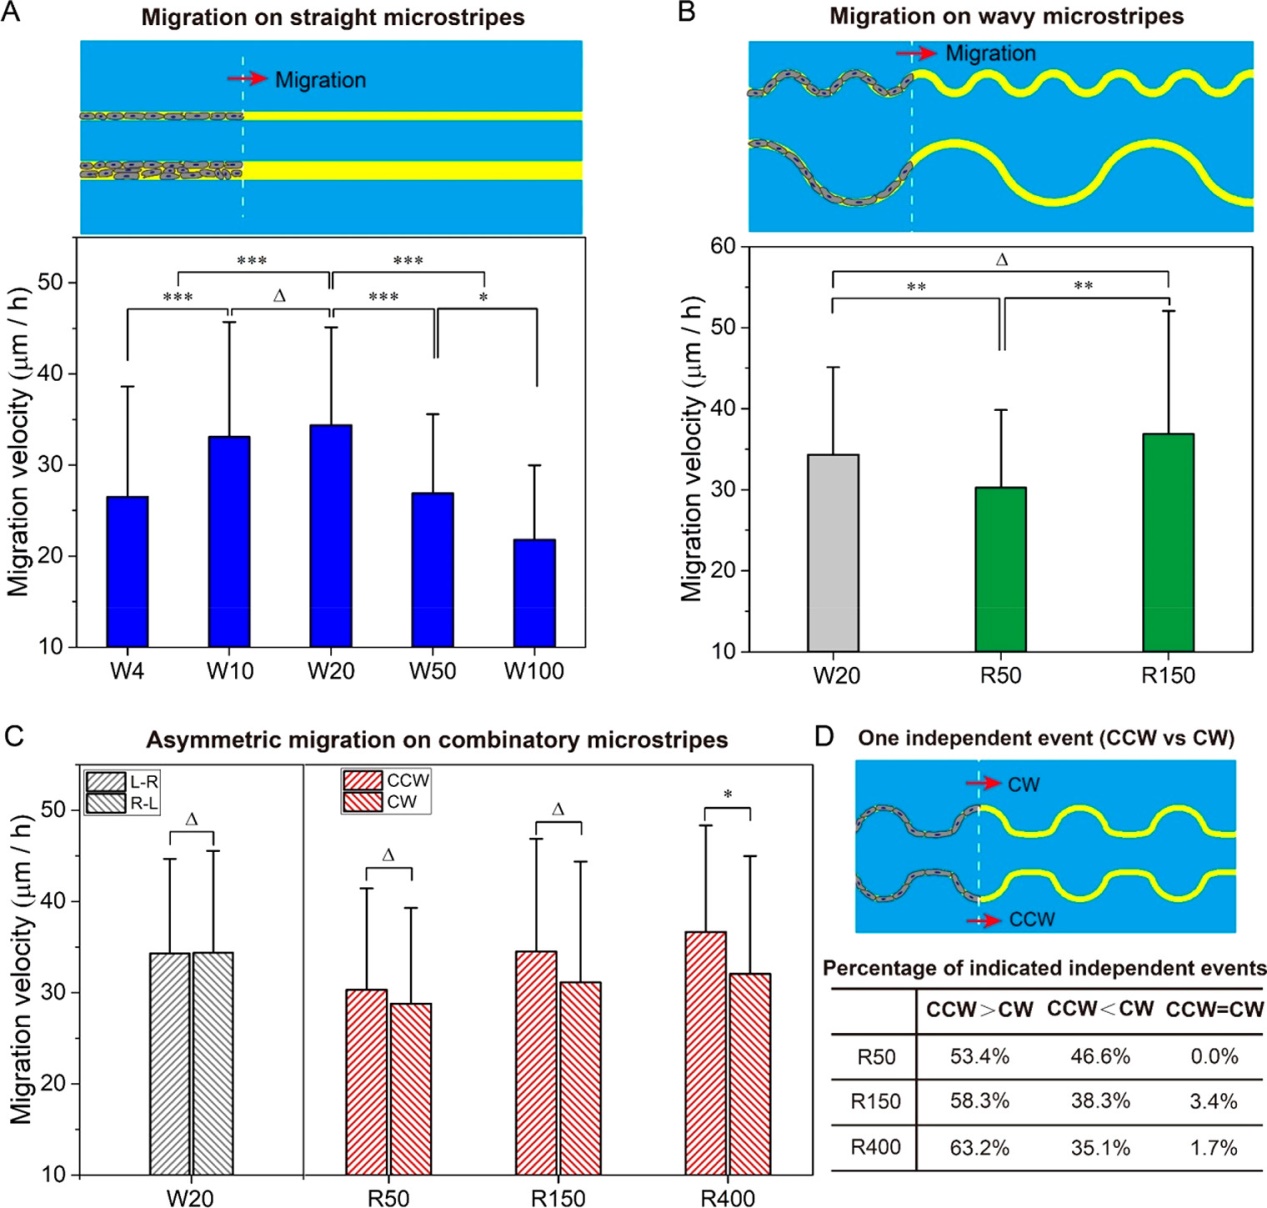
测定、统计和比较了细胞在不同形貌条纹微米图案上的迁移速率。(A)细胞在不同宽度的直线微米图案上的迁移示意图和迁移速率计算统计结果。条纹宽度为μm (W4), 10 μm (W10), 20 μm (W20), 50 μm (W50)和100 μm (W100)。(B)细胞在不同半径的波浪形微米图案上的迁移示意图和迁移速率计算统计结果。条纹宽度为20μm,半径为50 μm (R50) and 150 μm (R150)。(C)细胞在CW和CCW微米条纹图案上迁移速率统计结果。其中波浪形条纹宽度均为20 μm,半径为50 μm (R50), 150 μm (R150), and 400 μm (R400)。(D)细胞在一组相邻CW和CCW微米条纹图案上迁移作为统计学独立事件的示意图。
Migration of rMSCs on microstripes with varied features during the initial 6 h. (A) Schematic presentation of cell migration on straight microstripes and statistical results of migration velocity on the straight stripes with width of 4 μm (W4), 10 μm (W10), 20 μm (W20), 50 μm (W50), and 100 μm (W100). For each group, n ≥ 40. (B) Schematic presentation of cell migration on wavy microstripes and statistical results of migration velocity on the wavy stripes with a given stripe width of 20 μm yet varied arc radiuses of 50 μm (R50) and 150 μm (R150). For each group, n ≥ 40. (C) Statistical results of CW and CCW migration velocities of cells on combinatory microstripes of the same width of 20 μm yet with arc radius of 50 μm (R50), 150 μm (R150), and 400 μm (R400). For each group, n ≥ 60. The left part shows the statistical results of left to right (L-R) and right to left (R-L) migration velocities on W20. (D) Schematic presentation of one independent event for the comparison of CW and CCW migrations on two adjacent combinatory microstripes with the same arc radius and corresponding statistical results of the percentage of independent events. Here, “CCW = CW” means 99% × CW ≤ CCW ≤ 101% × CW. “Δ”: p > 0.05; “*”: 0.01 < p < 0.05; “**”: 0.001< p < 0.01; “***”: p < 0.001.