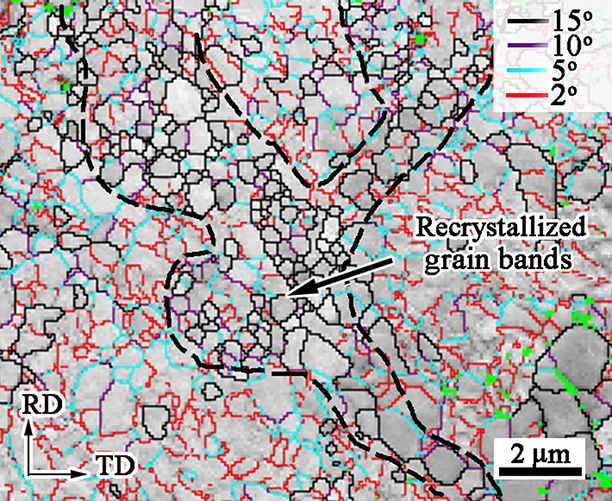
用T-EBSD测量的典型微观结构如图4(a)所示。根据晶体错向勾画出晶界(GBs)。大角度GBs与错误的方向大于15◦概述在黑色。低角度GBs与5-15◦错误方向和子GBs与2◦-5◦错误方向概述在紫色(> 10◦),蓝色(> 5◦)和红色(> 2◦),分别。在虚线勾画的分支带中,87个Zn晶粒被大角度的Gbs包围,其尺寸(即等效直径)计算为530±230 nm。以长径比≤2为准则[25]时,大多为等轴晶粒。但在带外区域,很少有颗粒被大角度的伽马射线完全包围。这些区域的晶粒以低角基粒和亚基粒划分。支带由再结晶的Zn晶粒组成,而条带外的Zn晶粒未再结晶。图4(a)中,大角度Gbs共包围了150个晶粒,平均尺寸为640±440 nm(图4(b))。条带外大的非再结晶晶粒可以达到约4nm的尺寸。图4(c)的核平均错向图表明,该带内的晶粒存在小于1◦的非常小的局部错向(图4(d))。而在波段外,低角度和亚基频附近的定向偏差较大。 为了显示晶粒取向,图4(e)将图4(a)中的相同区域按反极图着色。大部分区域呈红色,表明大部分晶粒的c轴(即[0001])几乎平行于ND。图4(e)的极图证实了Zn晶粒具有较强的基底织构。 然而,在再结晶晶粒带中,许多晶粒呈绿色或蓝色,颜色接近于反极图(IPF)的[11-20]和[10-10]角,说明在该带中基底织构减弱。
A representative microstructure measured by the T-EBSD is shown in Fig. 4(a). Grain boundaries (GBs) are outlined according to crystal misorientations. Large-angle GBs with misorientations larger than 15◦are outlined in black. Low-angle GBs with 5-15◦ misorientations and sub-GBs with 2◦-5◦misorientations are outlined in purple (> 10◦), blue (> 5◦) and red (> 2◦), respectively. In a branched band outlined by dashed lines, 87 Zn grains are enclosed by large-angle GBs, the size of which (i.e. equivalent diameter) is calculated to be 530 ± 230 nm. Taking aspect ratios ≤ 2 as a criterion[25], most of them are equiaxed grains. However, in the regions outside the band, few grains can be completely enclosed by large-angle GBs. The grains in these regions are divided by low-angle GBs and sub-GBs. The branched band consists of recrystallized Zn grains, while outside the band Zn grains have not been recrystallized.There are 150 grains enclosed by the large-angle GBs in total in Fig. 4(a),and their average size is 640 ± 440 nm (Fig. 4(b)). Large non-recrystallized grains outside the band can reach the size of about 4 nm.The kernel average misorientation map in Fig. 4(c)shows that the grains in the band have very small local misorientations of less than 1◦(Fig. 4(d)). However, outside the band, much higher misorientation is in the vicinity of low-angle and sub-GBs. It is further confirmed that the branched band in Fig. 4(a) is composed of recrystallized Zn grains.In order to show grain orientation, the same region in Fig. 4(a) is shown in Fig. 4(e), colored according to the inverse pole figure. Most of the region is in red, indicating that most grains’ c-axes (i.e., [0001]) are nearly parallel to ND. The pole figure in Fig. 4(e) confirms that Zn grains exhibit a strong basal texture.However, in the recrystallized grain band, many grains are green or blue, colors close to [11-20] and [10-10] corners of the inverse pole figure (IPF), indicating that the basal texture is weakened in this band.