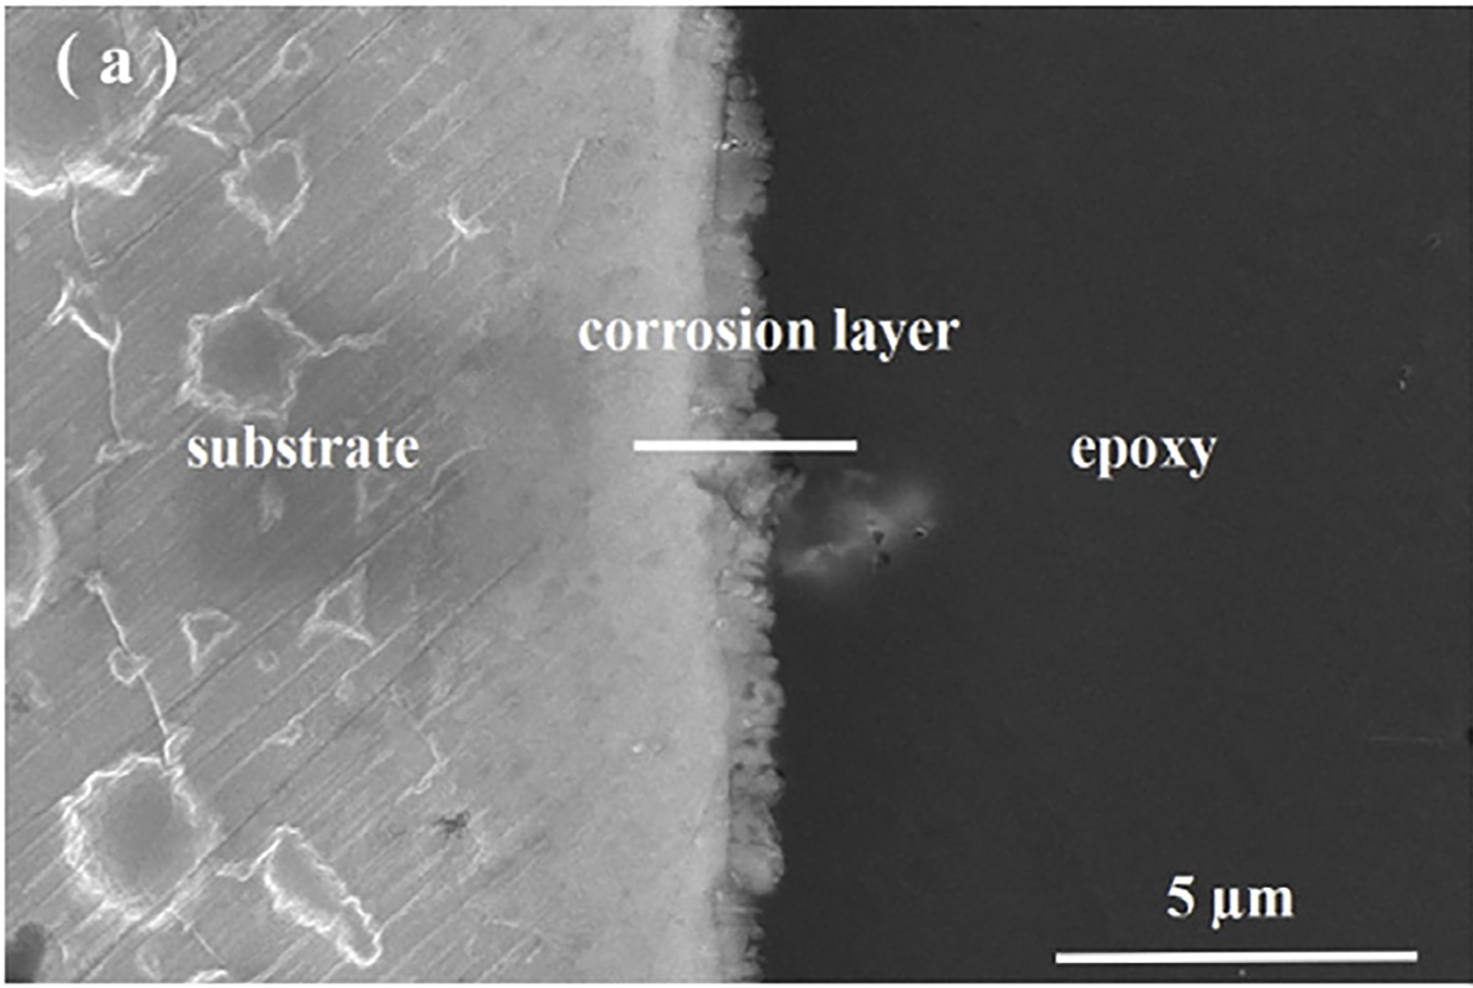
锌的降解行为是通过从样品中产生一系列横截面来阐明的。图3中的扫描电镜图像和能谱图是通过对浸泡120小时、240小时和336小时的锌样品的横截面观察和线扫描获得的。可以观察到腐蚀层的厚度随着浸泡时间的增加而增加(图3a和c)。一薄层(约1.5微米)在浸入120小时后在样品表面上形成(图3a)。随着浸泡时间的延长至240 h,腐蚀层变得致密,厚度约为。形成3μm(图3b)。当浸泡时间延长到336小时时,腐蚀产物的厚度达到最大值6μm(图3c)。浸泡336小时后表面被棒状腐蚀产物覆盖。根据能谱线扫描剖面,可以观察到腐蚀产物层主要由锌、氯和氧组成(图3d和f)。可以看出,腐蚀层中锌和氧的强度随着浸泡时间的延长而增强。浸泡240小时后,氧在腐蚀层中富集,336小时后,氧的强度比初始浸泡时间更强,表明腐蚀层主要由含氧产物组成
The degradation behavior of the zinc was elucidated by creating a series of cross sections from samples. SEM images and EDS profile in Fig. 3 were acquired from the cross-sectional observation and line-scan of Zn samples immersed for 120 h, 240 h and 336 h. It can be observed that the thickness of the corrosion layer increased with the immersion time (Fig. 3a and c). A thin layer (ca. ∼1.5 μm) was formed on the sample surface after immersion for 120 h (Fig. 3a). With the prolonging of immersion time to 240 h, a compact corrosion layer with thickness of ca. 3μm was formed (Fig. 3b). The thickness of corrosion product reached a maximum value to 6μm when the immersion time was prolonged to 336 h (Fig. 3c). And the surface after immersion 336 h was covered by rod-like corrosion products. According to the EDS line scan profiles, it can be observed that the corrosion product layer was mainly consisted of Zn, Cl and O (Fig. 3d and f). It can be seen that the intensity of Zn and O in the corrosion layer enhanced along with the immersion time. The O was enriched in the corrosion layer after immersion for 240 h and the intensity of O become quite stronger than the initial immersion time after 336 h, indicating that corrosion layer was mainly composed by oxygen-containing products.