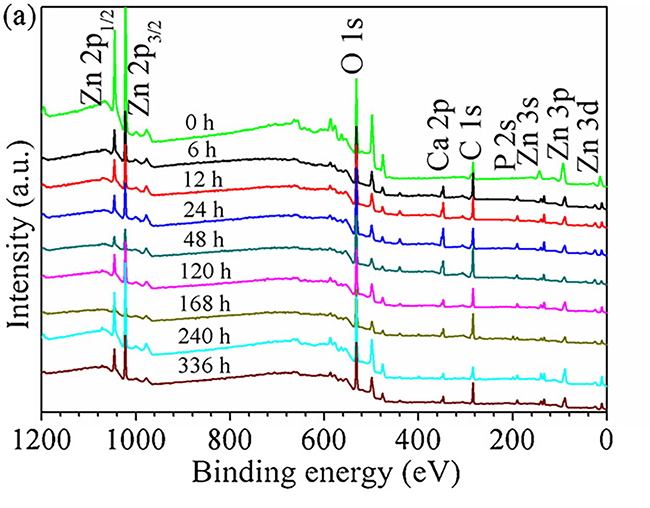
纯锌浸泡不同时间后的 XPS 分析结果如图 8 所示。图 8(a) 显示了所有样品的 XPS 调查。与浸泡前的纯 Zn 相比,在 r-SBF 中浸泡 6 小时后不久,在样品上检测到 P 2p 和 Ca 2p 的新峰。这些结果表明腐蚀产物主要由Zn、O、Ca、P和C元素组成。不同浸泡时间后腐蚀产物的化学成分无显着差异。为了获得有关腐蚀产物的详细信息,还收集了 P 2p 和 Zn 2p3/2 的高分辨率 XPS 数据。
P 2p 光谱如图8(b)所示。很明显,浸泡120 h后P 2p 峰向低结合能移动,这可以用腐蚀产物随浸泡的变化来解释。如图 8(d-g) 所示,观察到的峰被分解为位于 133.93 eV、133.50 eV 和 133.20 eV 的三个贡献,它们分别与 Zn3(PO4)2、CaHPO4·2H2O 和 Ca3(PO4)2相关。腐蚀产物中各组分的比例见表5。随着浸泡时间的延长,Zn3(PO4)2 的比例从 72.2 逐渐下降到 49.0,而 Ca3(PO4)2 和 CaHPO4·2H2O 的比例增加很明显被发现了。这一结果表明磷酸钙化合物在样品表面连续积累。
图 8(c) 展示了纯 Zn 的 Zn 2p3/2 光谱作为浸渍时间的函数。浸泡后峰强度显着降低,并且结合能随时间的变化清楚地观察到。使用归因于分别位于 1022.26 eV 和 1021.68 eV 的 ZnO/Zn(OH)2 和 Zn 的两个贡献来分解光谱(图 8(h))。此外,与 Zn3(PO4)2 相关的新峰出现在 1022.99 eV,并在进一步浸入过程中与 ZnO/Zn(OH)2 共存(图 8(i-l))。 Zn 的强度在初始浸泡时逐渐降低,168 小时后几乎检测不到(图 8(k))。相比之下,Zn3(PO4)2 的比例从 6 h 的 17% 逐渐增加到 336 h 的 50.1%。这些结果证实了腐蚀产物中存在 ZnO/Zn(OH)2 和 Zn3(PO4)2。
The XPS analysis results of pure Zn after immersion for different time are displayed in Fig. 8. Fig. 8(a) shows the XPS survey of all samples. Compared to the pure Zn before immersion, new peaks of P 2pand Ca 2p were detected on the samples shortly after immersion in r-SBF for 6 h. These results revealed that the corrosion products mainly consisted of Zn, O, Ca, P and C elements. There was no significant difference in chemical composition of the corrosion products after different immersion time. In order to obtain detailed information about the corrosion products, high resolution XPS data for P 2pand Zn 2p3/2were also collected.
The P 2p spectra are depicted in Fig. 8(b). It was obvious that the P 2p peaks shift towards low binding energy after 120 h immersion, which can be explained by the changes of corrosion products with immersion. As seen in Fig. 8(d–g), the observed peaks were decomposed into three contributions located at 133.93 eV, 133.50 eV and133.20 eV, which are associated with Zn3(PO4)2, CaHPO4·2H2O and Ca3(PO4)2, respectively. The proportion of the components in the corrosion products were listed in Table 5. With the extension of immersion time, the proportion of Zn3(PO4)2 decreased gradually from 72.2 to 49.0, whilst the increment of Ca3(PO4)2 and CaHPO4·2H2O were obviously detected. This result suggested the successive accumulation of calcium phosphate compounds on the sample surfaces.
Fig. 8(c) demonstrates the Zn 2p3/2 spectra of pure Zn as functions of the immersion time. The peak intensity decreased significantly after immersion and the changes in binding energy were clearly observed with time. The spectra were decomposed using two contributions attributed to ZnO/Zn(OH)2 and Zn located at 1022.26 eV and 1021.68 eV , respectively (Fig. 8(h)). Additionally, a new peak associated with Zn3(PO4)2 was present at 1022.99 eV, and coexisted with ZnO/Zn(OH)2 species during further immersion (Fig. 8(i–l)). The intensity of Zn gradually decreased in the initial immersion and was hardly detected after168 h (Fig. 8(k)). In contrast, the proportion of Zn3(PO4)2 increased gradually from 17% for 6 h to 50.1% for 336 h. These results confirmed the presence of ZnO/Zn(OH)2 and Zn3(PO4)2 in the corrosion products.