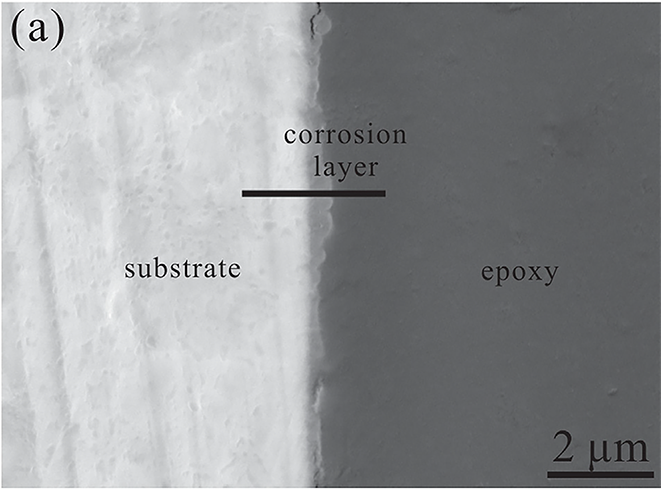
为了研究腐蚀沿深度的传播,从浸泡 120 手 240 小时的 Zn 样品的横截面观察中获得了 SEM 图像和 EDS 线轮廓。如图 6(a)所示,浸泡 120 小时后在样品表面形成薄层(~0.5 微米),腐蚀层变得致密,浸泡 240 小时后厚度约为 2.7 微米(图 6(c))。根据 EDS 线扫描剖面,可以观察到腐蚀产物层由 Zn、P、Ca 和 O 组成,这可以归因于浸泡过程中氧化锌/氢氧化物和锌/磷酸钙的形成(图 6(b)和 d))。很明显,腐蚀层的 Zn 信号强度比基体的弱,因为 Zn 在浸渍过程中溶解并与表面附近的其他元素形成腐蚀产物。此外,浸泡 240 小时后 Ca 和 P 信号的强度变强(图 6(d))。 EDS 分析表明,Zn 的腐蚀在 r-SBF 中逐渐进行。同时,随着浸泡时间的延长,磷酸钙不断地沉淀在样品表面。
In order to investigate the corrosion propagation along the depth, SEM images and EDS line profiles were acquired from the cross-sectional observation of the Zn samples immersed for 120 hand 240 h. As shown in Fig. 6(a), a thin layer (∼0.5 μm) was formed on the sample surface after immersion for 120 h and the corrosion layer became compact and the thickness was about 2.7 μm after immersion for 240 h (Fig. 6(c)). According to the EDS line scan profiles, it can be observed that the corrosion product layer consisted of Zn, P, Ca and O, which could be assigned to the formation of zinc oxide/hydroxide and zinc/calcium phosphate during immersion (Fig. 6(b and d)). It was evident that the intensity of the Zn signal from the corrosion layer becomes weaker than from the substrate because Zn dissolved during the immersion and formed corrosion products with other elements near the surface. Besides, the intensity of Ca and P signals became strong after immersion for 240 h (Fig. 6(d)). The EDS analysis suggested that the corrosion of Zn proceeds gradually in r-SBF. Meanwhile, calcium phosphate precipitated continuously on the sample surface with longer immersion time.