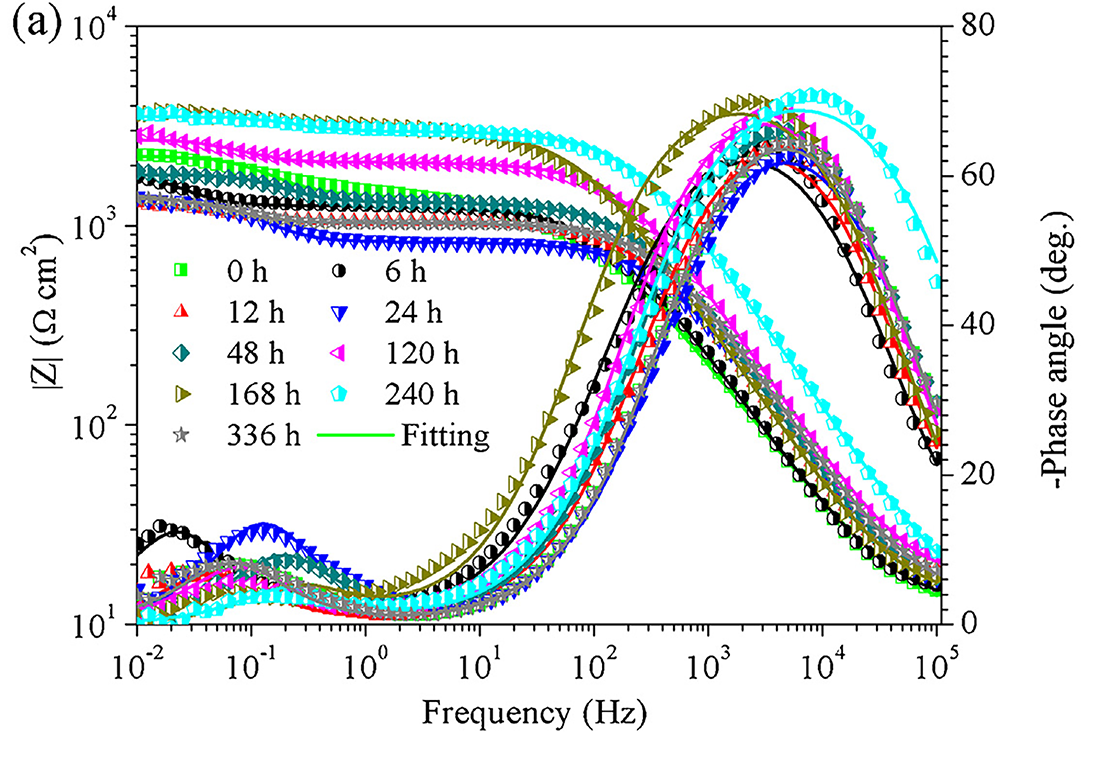
图 3(a) 描绘了纯 Zn 在不同时间点的 Bode 图。在高频和低频处清晰地观察到两个峰,表明存在两个时间常数。为了阐明纯锌在不同浸泡时间后的耐腐蚀性能,应用等效电路(EEC)来拟合 EIS 结果。如图3(b)所示,Rs为溶液电阻,Rct和Qdl代表电荷转移电阻和双电层电容;此处使用 Q 代替电容器来补偿系统的非均匀性。 Rc 和 Cc 代表腐蚀产物层的电阻和电容。表 3 汇总了两个拟合参数。由于测试中使用了相同的解决方案,Rs 值几乎相同。纯锌的 Rc 和 Rct 也呈现相同的趋势,在 24 h 内下降,然后逐渐增加到 168 h,之后再次下降。正如 Heakal 等人报道的那样。 ,总电阻值 Rt,由 Rt=Rc+Rct 给出,可用于评估样品的耐腐蚀性。图 3(c)描绘了 Rt 的趋势。观察到腐蚀趋势与 PDP 和 EIS 的区别(图 2(b)和 3(d)),这可能是由对样品的不同激发引起的。
Fig. 3(a) portrayed the Bode plots of pure Zn at different timepoint. Two peaks were clearly observed at high and low frequency, indicating the existence of two time constants. In order to clarify the corrosion resistance of pure Zn after different immersion time, the equivalent electrical circuit (EEC) was applied to fit the EIS results. As shown in Fig. 3(b), Rs was the solution resistance, Rct and Qdl represented the resistance of charge transfer and capacitance of the electrical double layer; Q was used here in place of a capacitor to compensate for the non-homogeneity of the system. Rc and Cc represented the resistance and capacitance of corrosion product layer. Both fitted parameters were summarized in Table 3. Rs value was almost the same due to the same solution used in the test. The Rc and Rct of pure Zn displayed the same trend that decreased within 24 h, then increased gradually to 168 h and decreased again afterwards. As reported by Heakal et al., the total resistance value Rt, given by Rt= Rc+ Rct, can be used to evaluate the corrosion resistance of the samples. Fig. 3(c) depicted the trend of Rt. A distinction of the corrosion trend from the PDP and EIS was observed (Figs. 2(b) and 3(d)), which was likely caused by the different excitation over the samples.