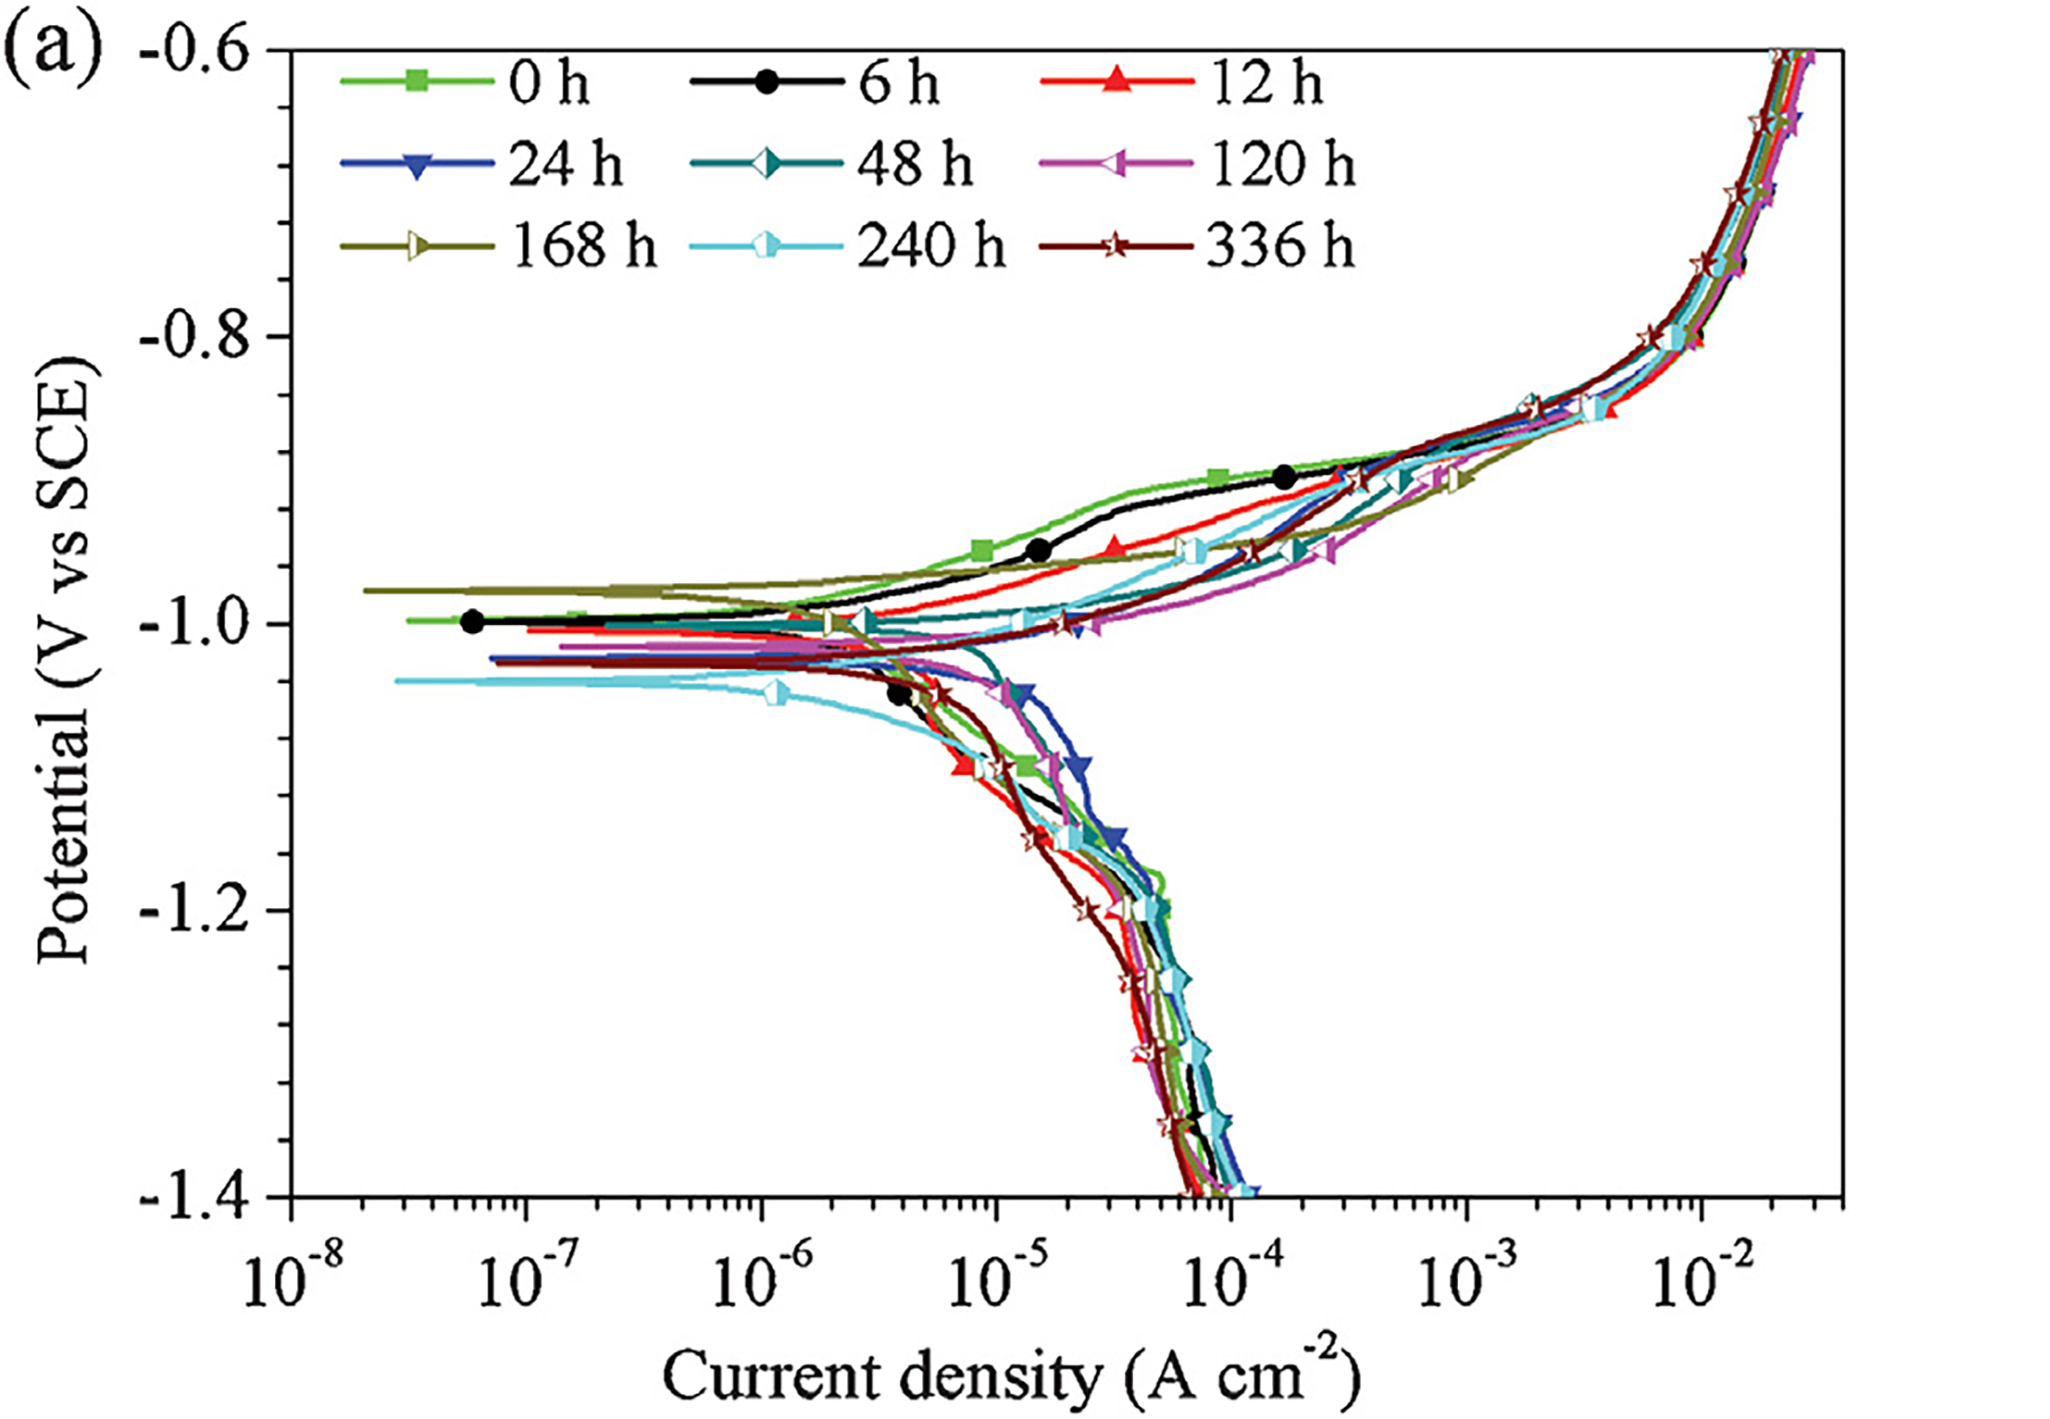
图 2(a)显示了纯 Zn 浸入r-SBF 不同时间后的 PDP 曲线。 除了 0 小时和 6 小时外,阳极分支显示出几乎相同的趋势,这表明类似钝化的区域和加速到高溶解速率。 阴极域包括一个几乎垂直的阶段直到-1.2 VSCE 和一个斜坡区域(主要范围从-1.2 VSCE 腐蚀电位),分别对应于氢气产生过程和氧气消耗过程。 从PDP曲线获得的相关参数Ecorr,Icorr和βc如表2所示。纯Zn的Ecorr值随着浸入的发展变化不大。 尽管如此,Icorr 值在浸入过程中经常波动,这在图 2(b)中可以清楚地看到。
Fig. 2(a) shows the PDP curves of pure Zn after immersion in r-SBF for different amount of time. The anodic branches showed nearly the same trend with the exception of 0 h and 6 h, which revealed passivation-like regions and acceleration to high dissolution rate. The cathodic domain included an almost vertical stage up to −1.2 VSCE and a slope region (mainly ranging from −1.2 VSCE to corrosion potential), which were corresponding to hydrogen generation process and the oxygen consumption process, respectively. The related parameters, Ecorr, Icorr and βc, obtained from the PDP curves were shown in Table 2. The Ecorr values of pure Zn did not change much as the immersion evolves. Neertherless, the Icorr values frequently fluctuated during the immersion, which can be seen clearly in Fig. 2(b).