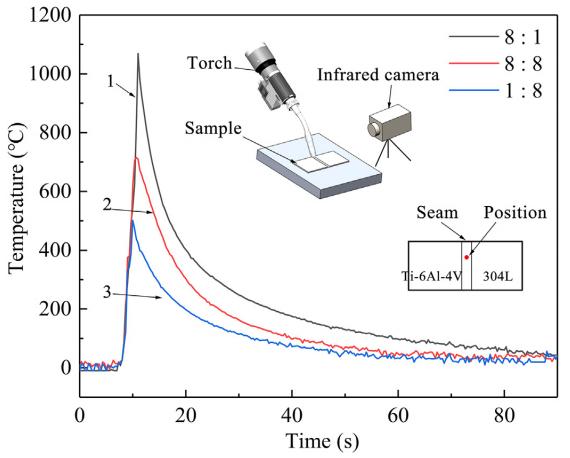
The figure shows the temperature–time profifiles of the selected spots, in-dicating that the holding time at high temperatures decreases with the ratio. Because the inspection frequency is 3 frames per second, the temperature–time profifiles obtained cannot accurately present the de-tails of the cooling curves.
The figure shows the temperature–time profifiles of the selected spots, in-dicating that the holding time at high temperatures decreases with the ratio. Because the inspection frequency is 3 frames per second, the temperature–time profifiles obtained cannot accurately present the de-tails of the cooling curves.