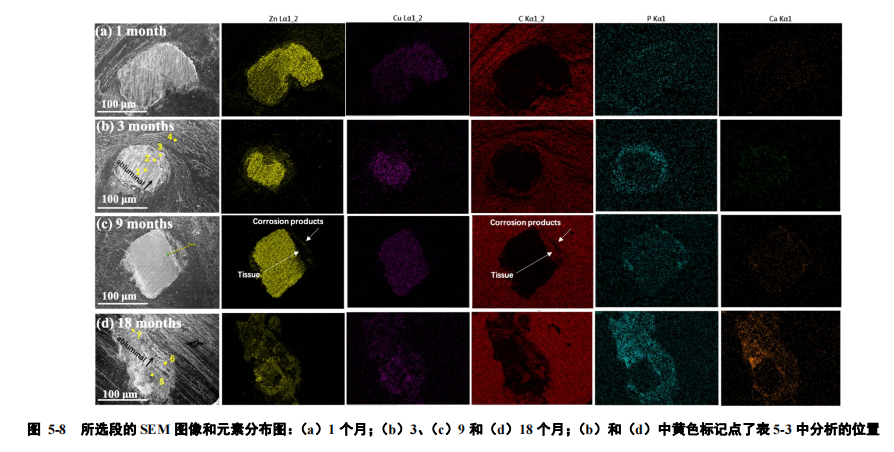
(a)1 个月;(b)3、(c)9 和(d)18 个月;(b)和(d)中黄色标记点了表 5-3 中分析的位置。在图 5-8(a)中,可以观察到支架杆周围出现了均匀的、薄薄的腐蚀产物层,并伴随着明显的 P 富集。图 5-8(b)中的腐蚀产物层在外腔方向上变厚,并且可以更清楚地观察到该层中的 Ca 信号。图 5-8(c)中的白色箭头标记了降解的支架杆被正常组织所取代的位置,该部分组织位于腐蚀产物和支架杆之间,显示腐蚀产物在组织内经历了位置迁移。图 5-8(d)表明,腐蚀产物在植入 18 个月后已经扩散到附近的组织中。
(A) 1 month; (b) 3, (c) 9 and (d) 18 months; (b) and (d) the yellow markers indicate the positions analyzed in Table 5-3. In Figure 5-8(a), it can be observed that a uniform and thin corrosion product layer appears around the stent rod, accompanied by obvious P enrichment. The corrosion product layer in Figure 5-8(b) becomes thicker in the direction of the outer cavity, and the Ca signal in this layer can be observed more clearly. The white arrow in Figure 5-8(c) marks the position where the degraded stent rod is replaced by normal tissue. This part of the tissue is located between the corrosion product and the stent rod, indicating that the corrosion product has undergone positional migration in the tissue. Figure 5-8(d) shows that corrosion products have spread to nearby tissues 18 months after implantation.