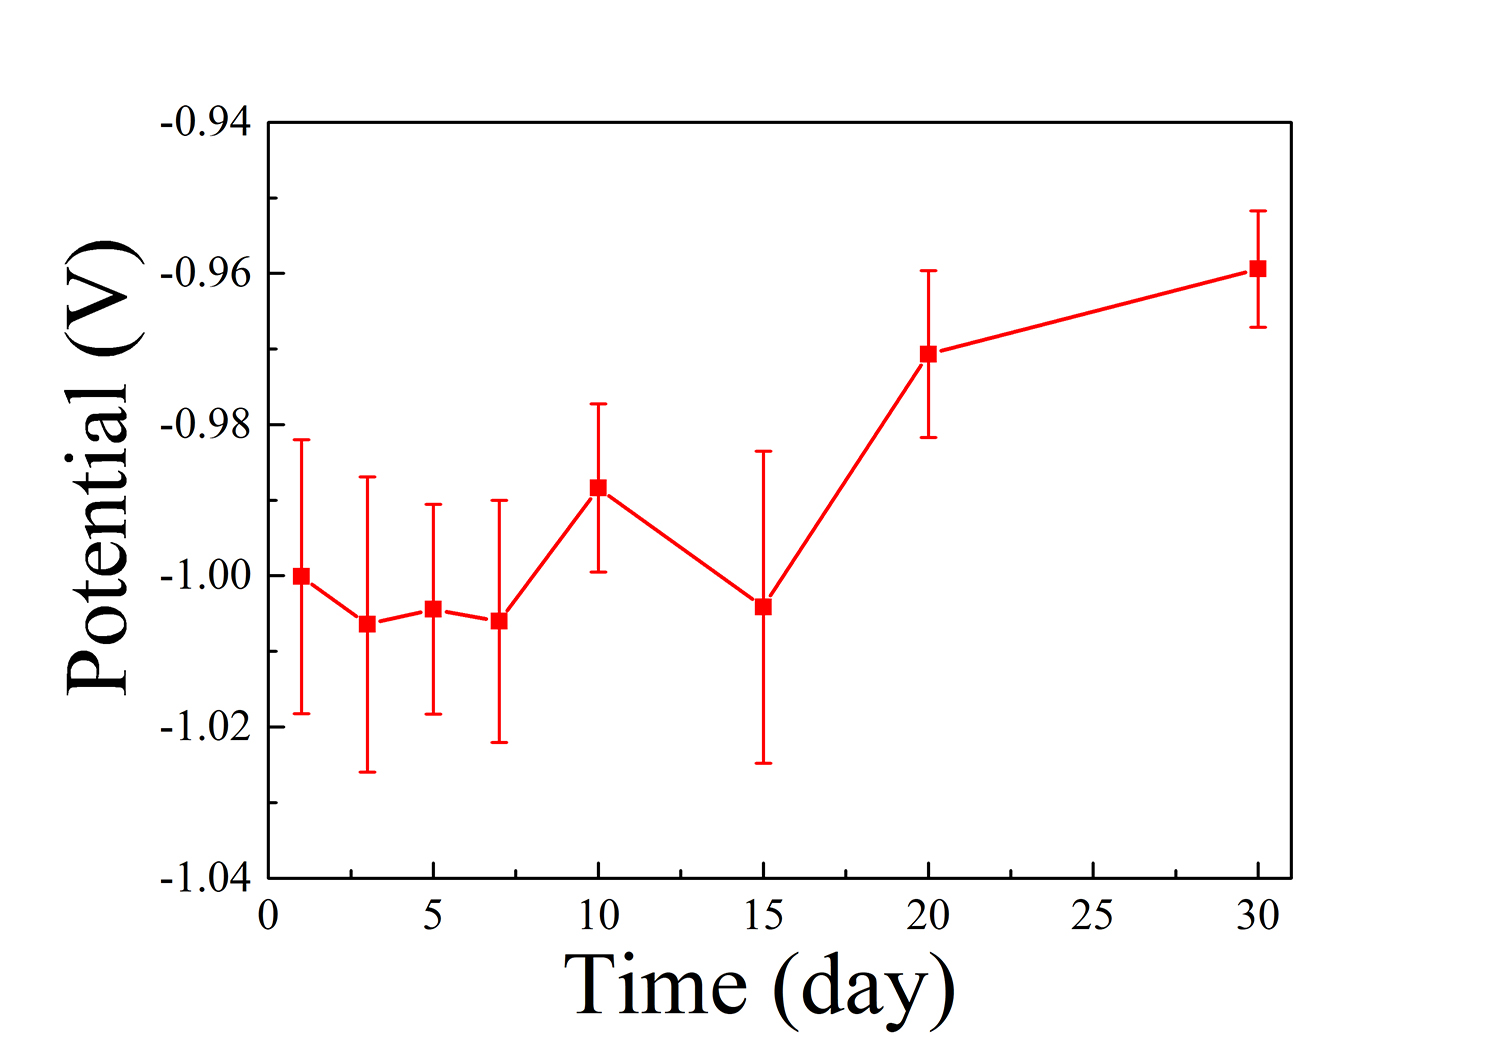
图11(a)绘出了对应于不同时间在SBF测试的合金的OCP值的评估。除了第15天的骤降,OCP值随着浸泡时间的增加而增加,表明表面形成了具有较高电位的稳定腐蚀层。第15天的骤降归因于明显的点蚀和表面腐蚀层的转变(图7(f)),这使活性基底再次暴露于SBF。对材料进行等离子体显示板测试是为了比较浸入合金的耐腐蚀性随时间的变化(图11(b))。阳极和阴极的Tafel斜率随浸泡时间而变化,表明腐蚀层的变化影响锌基体的溶解和氧的消耗。表5列出了相应的参数,包括腐蚀电位(Ecorr)、icorr、a和b值。由于含锂钝化层的形成,100-150毫伏的钝化区在前5天内出现在等离子体显示板曲线的阳极分支中。被动面积在前3天内增加,随后减少。同时,膜的击穿电位随时间而降低,表明含锂膜的动力学势垒效应随时间而降低。随着时间的推移,浸入式合金的电致变色值略有增加,与OCP结果一致。第1天至第5天的icorr值远低于其他时间点,然后icorr值随着浸泡时间逐渐增加,除了第15天的突然增加,这与新暴露的合金表面位置上非保护性溶解产物的生长有关。因此,上述浸入合金的极化特性表明,表面层的形成与时间有关,为阳极溶解提供了动力学屏障,尤其是在初始浸入阶段。图11(c)和(d)示出了在SBF浸泡不同天的WR合金的交流阻抗谱。如奈奎斯特曲线(图11(c))所示,在5天内,对于浸入的合金,在低频区域观察到扩散阻抗特性,由低频区域中曲线的上升斜率和最低频率下上升的阻抗模量(|Z|)证明(图11(d))。电容回路的直径在前5天内增加,然后直到第30天减小。两个时间常数存在于样品的波特曲线中(图11(e)),因此使用具有沃伯格(W)或盖里舍尔(G)扩散阻抗的两个时间常数模型来拟合所有样品的电化学阻抗谱数据。图11(e)显示了安装的等效电路。Rsvalue代表溶液电阻。Rdland分别代表金属/电解质界面的电荷转移电阻和双电层。这两个量描述了第一个高频容量环路。R1和cpe1分别代表薄膜电阻和电容,它们描述了低频下的第二电容环路。CPE是一个恒定的相位元素,用于补偿系统中的非均匀性。
Fig. 11(a) plots the evaluation of OCP values corresponding to alloys tested in SBF at different time. Except plunges at day 15, the OCP values increase with the immersion time, indicating a stable corrosion layer with higher potential forms on the surface. The plunge at day 15 is attributed to the distinct pitting corrosion and the transformation of corrosion layer on the surface (Fig. 7(f)), which exposures the active substrate again to the SBF.PDP testing on the materials is conducted to compare the corrosion resistances of immersed alloys with time (Fig. 11(b)). Both anodic and cathodic Tafel slopes change with immersion time, indicating that changes of corrosion layer affect dissolution of the Zn matrix and oxygen consumption. Corresponding parameters including corrosion potential (Ecorr), icorr, ˇaand ˇcslopes are listed in Table 5. Passivation zones of 100−150 mV appear in anodic branches of the PDP curves within first 5 days, due to the formation of Li-containing passive layer. The passive area increases within the first 3 days, then decreases afterwards. Meanwhile, the film break down potential decreases with time, indicating the decreasing of kinetic barrier effects of Li-containing film with time. Ecorrval-ues of immersed alloys increase slightly with time, consistent with the OCP results. The icorr values at day one to day 5 are much lower than that of other time points, then icorr values increase gradually with immersion time except a sudden increase at day 15, which is associated with the growth of un-protective dissolution products upon freshly exposed alloy surface sites. Therefore, the polarization characteristics of immersed alloys above demonstrate that there is a time dependent surface layer formation that provides a kinetic barrier to the anodic dissolution, especially pronounced at initial immersion period.Fig. 11(c) and (d) shows the EIS spectra of WR alloy immersed in SBF for different days. As shown in the Nyquist curves (Fig. 11(c)), a diffusion impedance character is observed in the low frequency region for immersed alloys within 5 days, evidenced by the rising slope of the curve in the low frequency region and the rising impedance modulus (|Z|) at the lowest frequency (Fig. 11(d)). The diameters of capacitive loop increase within first 5 days and then decrease till day 30. Two-time constants exist in the Bode curves of the specimens (Fig. 11(e)), so that a two-time constants model with the Warburg (W) or Gerischer (G) diffusion impedance is used to fit the EIS data of all the specimens. The fitted equivalent circuit is shown in Fig. 11(e). Rsvalue represents the solution resistance. R1 and CPE1 represent charge transfer resistance and the electric double layer at the metal/electrolyte interface, respectively. The two quantities describe the first capacity loop at high frequency. R1and CPE1represent the film resistance and capacity, respectively, which describe the second capacity loop at low frequency. CPE is a constant phase element and is employed here to compensate the non-homogeneity in the system.Figure 11(e) shows the equivalent circuit of the installation. Rsvalue represents the resistance of the solution. Rdland represents the charge transfer resistance and electric double layer at the metal/electrolyte interface, respectively. These two quantities describe the first high-frequency capacity loop. R1 and cpe1 represent thin-film resistors and capacitors, respectively, and they describe the second capacitor loop at low frequencies. CPE is a constant phase element used to compensate for non-uniformities in the system.