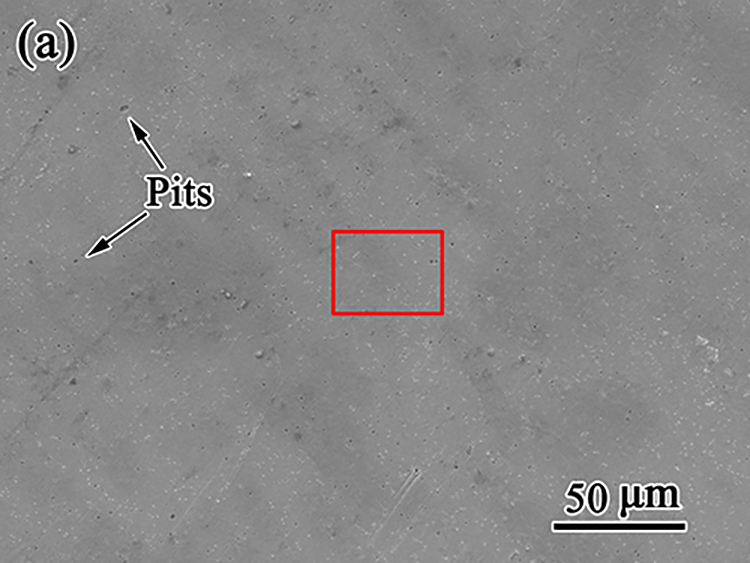
如图5所示,浸入合金的腐蚀形态随时间演变。1天后,观察到几个浅坑(图5(a))。7天内,致密的颗粒状产品覆盖了平坦的表面区域(图5(a1–D1)),表明均匀腐蚀占主导地位。此外,在第10天,在表面上形成分散的块状聚集体(图5(e1)),并随着时间的推移而变大。20天后,光滑区域减少,直径超过50的圆形腐蚀产物明显减少?在表面上观察到m(图5g),并且在30天后,更多松散的腐蚀产物在接近圆形中心的地方积累(图5(h))。如图5(h1)所示,在平坦区域的腐蚀层上出现明显的裂纹(如右侧所示)。
因此,在合金表面有三种典型的腐蚀产物形态(图5(i)),即致密粒状(形状1)、分散块状(形状2)和明显的圆形(形状3)腐蚀产物。他们相应的能谱分析列于表3。不同时期平整区域上1号形状腐蚀产物的相应能谱分析结果(图5(a–d))表明,它们的主要元素是碳、氧、锌、磷和钙,表明平整区域内有锌(OH)2/氧化锌和磷酸钙的堆积。能谱数据(第7点和第10–14点)证实,形状2和形状3腐蚀产物也主要由氢氧化锌和过磷酸钙组成,但碳、氧、钙、磷含量较高,锌含量低于形状1。这种形态上的差异可能是由于氢氧化锌晶体的不断生长和氯化钠在SBF的腐蚀。
平坦表面的锌氧比将腐蚀过程分为两个阶段(图5(j))。值得注意的是,在前7天内,锌氧比从13.5迅速下降到4.4,KP值为-1.12,代表了一个不稳定的第一腐蚀阶段,腐蚀速率很高。然后锌氧比在3.5左右波动,在静止时间内呈缓慢下降趋势,kp值为-0.05,表明腐蚀层处于稳定增厚阶段。
因此,在合金表面有三种典型的腐蚀产物形态(图5(i)),即致密粒状(形状1)、分散块状(形状2)和明显的圆形(形状3)腐蚀产物。他们相应的能谱分析列于表3。不同时期平整区域上1号形状腐蚀产物的相应能谱分析结果(图5(a–d))表明,它们的主要元素是碳、氧、锌、磷和钙,表明平整区域内有锌(OH)2/氧化锌和磷酸钙的堆积。能谱数据(第7点和第10–14点)证实,形状2和形状3腐蚀产物也主要由氢氧化锌和过磷酸钙组成,但碳、氧、钙、磷含量较高,锌含量低于形状1。这种形态上的差异可能是由于氢氧化锌晶体的不断生长和氯化钠在SBF的腐蚀。平坦表面的 Zn/O 比将腐蚀过程分为两个阶段(图 5(j))。 值得注意的是,前 7 天内 Zn/O 比值从 13.5 迅速下降到 4.4,kp 值为 -1.12,代表不稳定的第一腐蚀阶段,腐蚀速率很高。 然后Zn/O比值在3.5左右波动,在静止时间内呈缓慢下降的趋势,kp值为-0.05,表明腐蚀层稳定增厚阶段。
As shown in Fig. 5, corrosion morphology of the immersed alloy evolves with time. After 1 day, several superficial pits are observed (Fig. 5(a)). Dense and granular products cover the flat surface areas within 7 days (Fig. 5(a1–d1)), indicating the dominance of uniform corrosion. Additionally, scattered blocky aggregations form on the surface at day 10 (Fig. 5(e1)) and grow larger with time. After 20 days, less smooth area and appreciable circular corrosion products with diameters over 50 ?m are observed on the surface (Fig. 5g), and much more loose corrosion products accumulate approaching the circular center after 30 days (Fig. 5(h)). As shown in Fig. 5(h1), apparent cracks appear on the corrosion layer in a flat area (as shown on the right).
Accordingly, there are three typical morphologies of corrosion products on the alloy surface (Fig. 5(i)), i.e., dense granular (Shape1), scattered blocky (Shape 2) and appreciable circular (Shape 3) corrosion products. Their corresponding EDS analyses are listed in Table 3. The corresponding EDS results of Shape 1 corrosion products on flat area in different periods (Fig. 5(a–d)) show that their main elements are C, O, Zn, P and Ca, indicating accumulation Of Zn(OH)2/ZnO and calcium-phosphate in the flat area. EDS data (points 7 and 10–14) confirm that Shape 2 and Shape 3 corrosion products are also mainly composed of Zn(OH)2/ZnO and calcium-
phosphate, however with higher content of C, O, Ca, P and lower Zn than Shape 1 ones. The difference in morphology may attributed to continuous growth of Zn(OH)2/ZnO crystal and the corrosion of NaCl in SBF.
Zn/O ratio of the flat surface divides the corrosion process into two stages (Fig. 5(j)). It is worthy to note that the Zn/O ratio decreases rapidly from 13.5 to 4.4 within the first 7 days with kpvalue of -1.12, representing an unstable first corrosion stage with a high corrosion rate. Then the Zn/O ratio undulates around 3.5 in a slowly decreasing trend in the rest time with kp Value of -0.05, indicating a stable thickening stage of the corrosion layer.
Accordingly, there are three typical morphologies of corrosion products on the alloy surface (Fig. 5(i)), i.e., dense granular (Shape 1), scattered blocky (Shape 2) and appreciable circular (Shape 3) corrosion products. Their corresponding EDS analyses are listed in Table 3. The corresponding EDS results of Shape 1 corrosion products on flat area in different periods (Fig. 5(a–d)) show that their main elements are C, O, Zn, P and Ca, indicating accumulation of Zn(OH)2/ZnO and calcium-phosphate in the flat area. EDS data (points 7 and 10–14) confirm that Shape 2 and Shape 3 corrosion products are also mainly composed of Zn(OH)2/ZnO and calcium- phosphate, however with higher content of C, O, Ca, P and lower Zn than Shape 1 ones. The difference in morphology may attributed to continuous growth of Zn(OH)2/ZnO crystal and the corrosion of NaCl in SBF.Zn/O ratio of the flat surface divides the corrosion process into two stages (Fig. 5(j)). It is worthy to note that the Zn/O ratio decreases rapidly from 13.5 to 4.4 within the first 7 days with kp value of -1.12, representing an unstable first corrosion stage with a high corrosion rate. Then the Zn/O ratio undulates around 3.5 in a slowly decreasing trend in the rest time with kp value of -0.05, indicating a stable thickening stage of the corrosion layer.