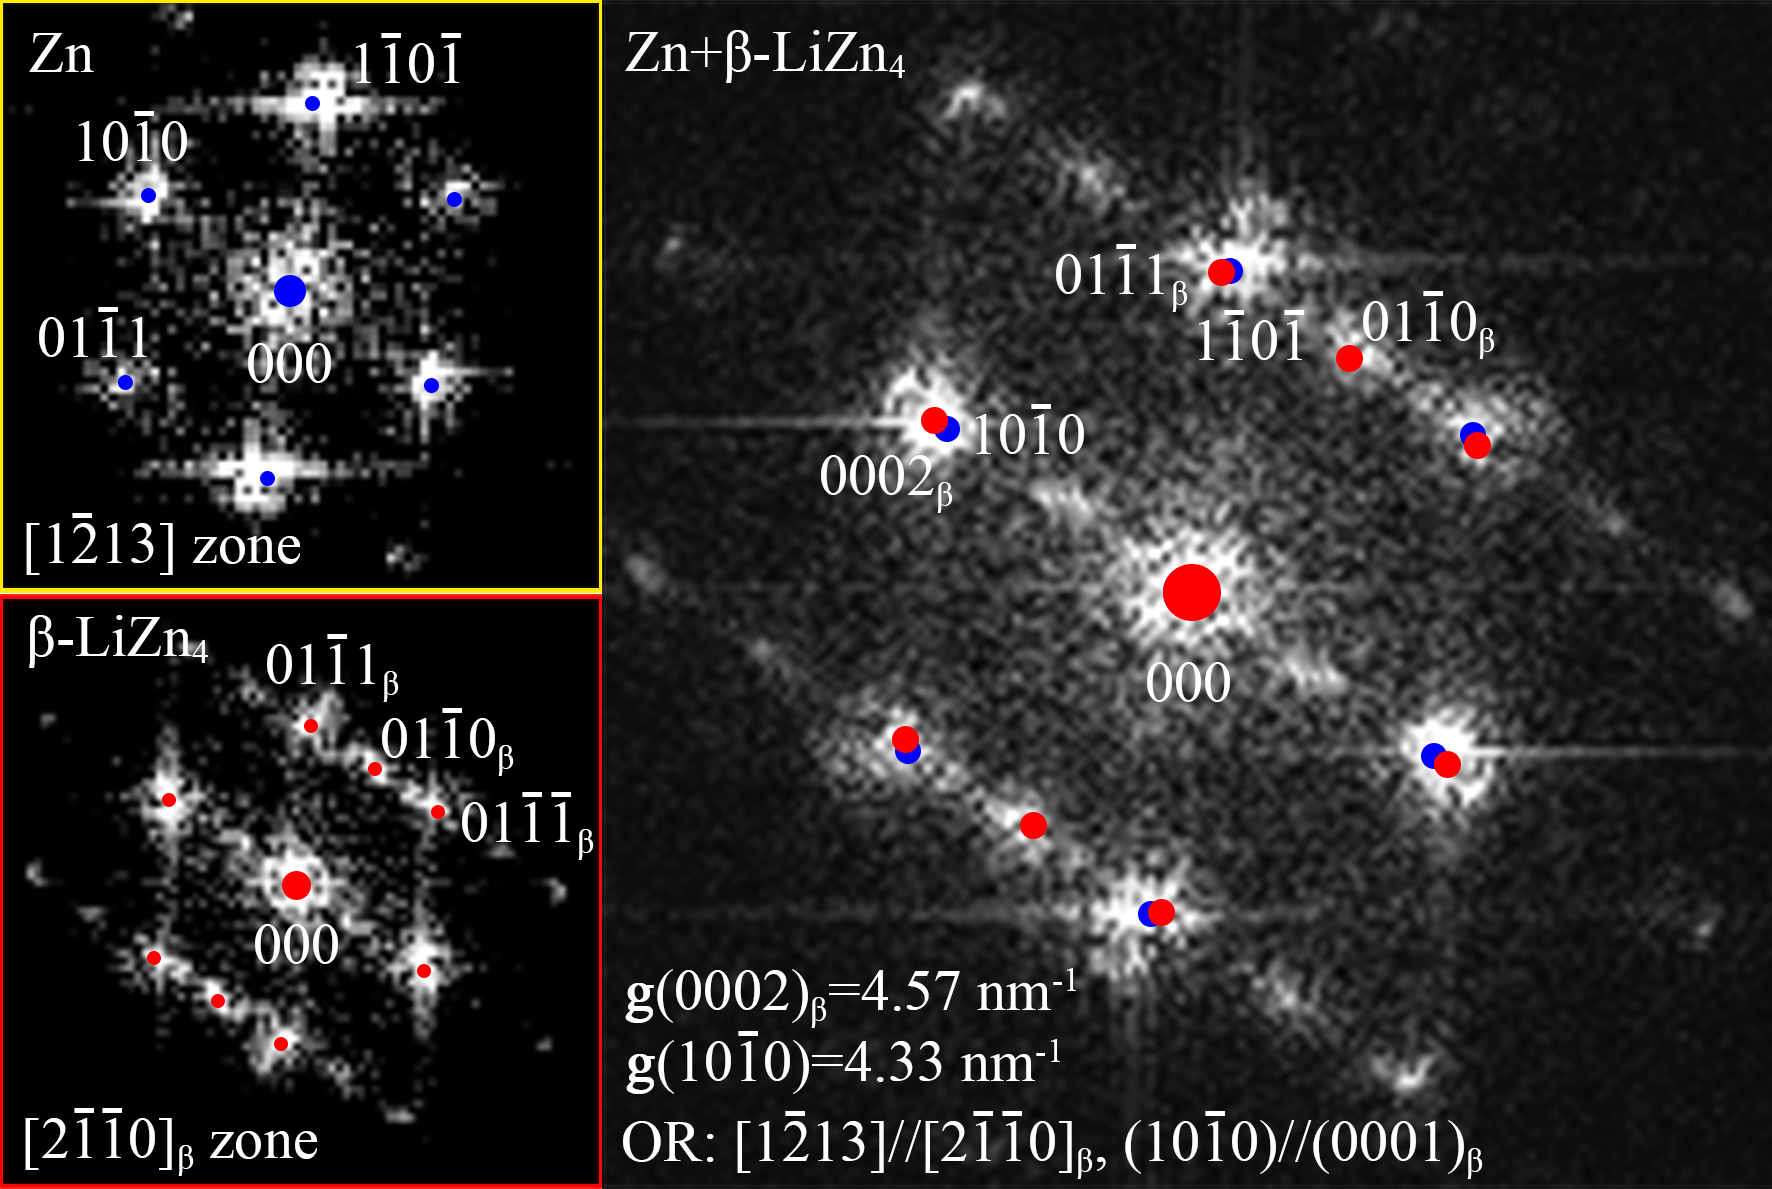
图4(a)显示了锌颗粒的TEM亮场图像。细沉淀物的颗粒内网络在这些颗粒中占优势,这可以在如图4(b)所示的放大的局部区域中更清楚地看到,如箭头所指。图4(b)所示的放大的局部区域中更清楚地看到,如箭头所指。该网络似乎大致由亚晶粒边界形成。图 4(b),如箭头所指。 该网络似乎大致由亚晶界形成。然而,图 4(c) 中的 HRTEM 图像提供了确凿的证据,表明它是由细小的 β-LiZn4 沉淀物形成的。 图中,Zn基体沿[1-213]区轴投影,而线状β-LiZn4沉淀沿[2-1-10]区轴投影。 沉淀物的宽度小于14 nm,长度至少为 40 nm。图4(d)那(0001)β平行于(10-10)。图4(d)给出了它们的快速傅里叶变换衍射图。为了引导图案索引,用蓝色或红色点示出的两个相位的计算衍射图案重叠在快速傅立叶变换图案上。使用两相的刚性(即,没有可能的约束,这将在后面讨论)晶格参数来执行计算(图1(b))。这种情况下,|g(0002)β|非常接近但不等同于| g(10-10)|,只有0.24nm-1的差异,该差异太小而不能在图4(d)右侧的重叠的快速傅立叶变换衍射图案中区分。结合图4(c)和(d),两相之间的取向关系(OR)可描述为[1–213]//[2–1–10]β, (10−10)//(0001)β。
Figure 4(a) shows the TEM bright field image of zinc particles. The intragranular network of fine precipitates dominates these particles, which can be seen more clearly in the enlarged local area as shown in Figure 4(b), as indicated by the arrow.It can be seen more clearly in the enlarged partial area shown in Figure 4(b), as indicated by the arrow. The network appears to be roughly formed by sub-grain boundaries.Fig. 4(b), as pointed out by arrows. The network seems roughly to be formed by subgrain boundaries. However, HRTEM image in Fig. 4(c) provides solid evidence that it is formed by fineβ-LiZn4 precipitates. In the figure, Zn matrix is projected along [1−213] zone axis, while a string-shaped β-LiZn4 precipitate is projected along [2–1–10] zone axis. The precipitate has a width less than 14 nm, and a length at least 40 nm.Figure 4 (d) that (0001) β is parallel to (10-10). Figure 4(d) shows their fast Fourier transform diffraction pattern. In order to guide the pattern index, the calculated diffraction patterns of the two phases shown with blue or red dots are superimposed on the fast Fourier transform pattern. The calculations are performed using the two-phase rigidity (ie, no possible constraints, which will be discussed later) lattice parameters (Figure 1(b)). In this case, |g(0002)β| is very close but not the same as | g(10-10)|, and there is only a difference of 0.24nm-1, which is too small to be on the right side of Figure 4(d) The overlapped fast Fourier transform diffraction patterns are distinguished. Combining Figure 4(c) and (d), the orientation relationship (OR) between the two phases can be described as [1–213]//[2–1–10]β, (10−10)//(0001)β.