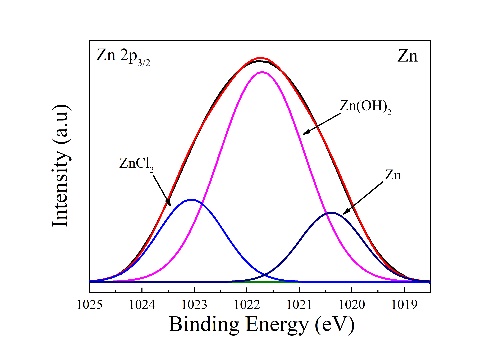
收集了典型样品表面上Zn2p3/2和Li1s的高分辨率XPS光谱,相应结果如图11a-g中所示,分别表示锌和锌(0.1-1.4)锂合金锌2p3/2光谱的曲线拟合。锌的Zn2p3/2峰在1020.4eV、1021.8eV和1023.1eV处,低结合能信号为Zn,而中结合能和高结合能信号分别为ZnO/Zn(OH)2和氯化锌。对于Zn-(0.1-1.4)Li合金,Zn2p3/2峰的拟合结果表明,富含锌的腐蚀产物为氯化锌、氧化锌、氢氧化锌和Zn5(CO3)2(OH)6(图11a–f)。根据Zn-(0.1-0.2)Li合金的Li1s区域光谱,在53eV到58eV的结合能范围内没有出现明显峰,而在Zn-(0.5-1.4)Li合金光谱中出现Li1s峰(图。11g–i)。Li1s光谱(图11g-i)显示,锂富腐蚀产物为氯化锂、氢氧化锂和Li2CO3,分别以55.8eV、54.9eV和55.2eV为中心。对于Zn-0.5Li合金,富锂腐蚀产物为Li2CO3和氯化锂。氯化锌和氯化锂的出现要归因于来自SBF的Cl−的粘附性。对于锌(0.8-1.4)Li合金,富含锂的腐蚀产物为氢氧化锂和Li2CO3。因此,当Li加成达到0.5%及以上时,锌腐蚀层的结构发生显著变化。
High-resolution XPS spectra of Zn 2p3/2 and Li 1 s on typical sample surfaces are collected and the corresponding results are listed in Table 5. Fig. 11a–g designate the curve fits of the Zn 2p3/2 spectra for Zn and Zn-(0.1–1.4)Li alloys after immersion in SBF for 1 day, respectively. The Zn 2p3/2 peaks for Zn are well fitted with three contributions at 1020.4 eV, 1021.8 eV and 1023.1 eV. The low-binding-energy signal is assigned to Zn, whereas the middle- and high-binding-energy signals are assigned to ZnO/Zn(OH)2 and ZnCl2, respectively. For Zn-(0.1–1.4) Li alloys, fitting results of Zn 2p3/2 peaks show that Zn-rich corrosion products are ZnCl2, ZnO, Zn(OH)2, and Zn5(CO3)2(OH)6 (Fig. 11a–f). According to spectra of Li 1 s region for Zn-(0.1–0.2)Li alloys, no obvious peaks appears in the binding energy range from 53 eV to 58 eV though Li 1 s peak appear in spectra of Zn-(0.5–1.4)Li alloys (Fig. 11g–i). Deconvolution of Li 1 s spectra (Fig. 11g–i) reveals that Lirich corrosion products are LiCl, LiOH and Li2CO3, centered at 55.8 eV, 54.9 eV and 55.2 eV, respectively. For Zn-0.5Li alloy, Li-rich corrosion products are Li2CO3 and LiCl (Fig. 11g). The appearance of ZnCl2 and LiCl is attributed to the adhesion of Cl− from SBF. For Zn-(0.8–1.4)Li alloys, Li-rich corrosion products are LiOH and Li2CO3 (Fig. 11h and i), all of which are aqueous insoluble. Therefore, the constitution of the corrosion layer of Zn varies significantly when Li addition reaches 0.5% and beyond.