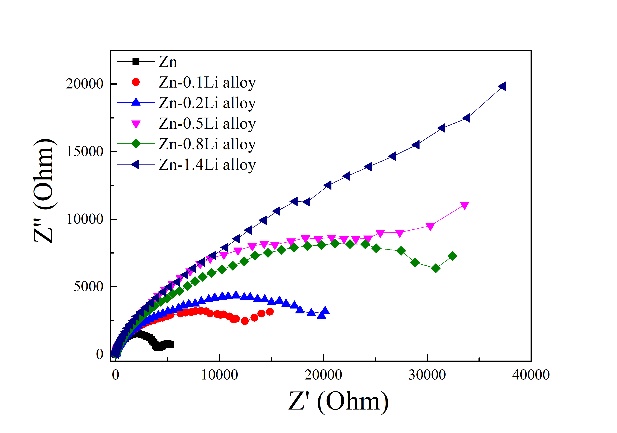
图6中示显示了在SBF中测试的锌和ZneLi合金的EIS光谱。Nyquist曲线如图6a)所示,在ZnLi合金的低频区域中可以观察到扩散阻抗特性,随着Li含量的增加,这一特征变得更加明显。图6b显示了低频区域曲线的斜率上升和最低频率的阻抗模量(|Z|)电容性回路的直径随着Li含量的增加而增大。在图6c中材料的Bode曲线中存在两个时间条件常数,从而使用具有格里彻(G)扩散阻抗的双时间常数模型来拟合所有样本的EIS数据。所安装的等效电路如图6d所示。图6d中Rs值表示溶液的电阻,Rdl和CPEdl分别表示金属/电解质界面上的电荷转移电阻和电动双层。这两个量在高频的情况下记录了第一个容量回路。R1和CPE1分别代表薄膜的电阻和容量。它们描述了在低频情况下的第二个容量回路。CPE是一种恒定相位元件,用于补偿系统中的非均匀性。
Fig. 6 shows the EIS spectra of Zn and ZneLi alloys tested in SBF. As shown in the Nyquist curves (Fig. 6a), a diffusion impedance character is observed in the low frequency region for the ZneLi alloys. This character becomes more distinct with increasing Li content, evidenced by the rising slope of the curve in the low frequency region and the rising impedance modulus (|Z|) at the lowest frequency (Fig. 6b). The diameters of capacitive loop increases with Li content. Two time-constants exist in the Bode curves of the materials (Fig. 6c), so that a twotime constant model with the Gerischer (G) diffusion impedance is used to fit the EIS data of all the specimens. The fitted equivalent circuit is shown in Fig. 6d. Rs value represents the solution resistance. Rdl and CPEdl represent charge transfer resistance and the electric double layer at the metal/electrolyte interface, respectively. The two quantities describe the first capacity loop at high frequency. R1 and CPE1 represent the film resistance and capacity, respectively. They describe the second capacity loop at low frequency. CPE is a constant phase element and is employed here to compensate the non-homogeneity in the system .