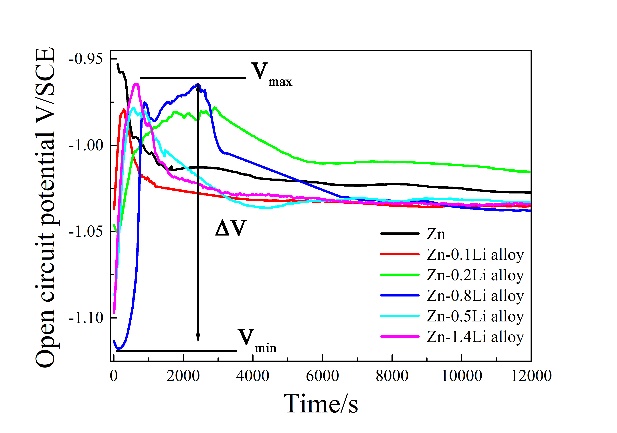
图5中描绘了在SBF中测试的Zn和ZnLi合金对应的OCP和PDP曲线。如图5a所示,典型的锌OCP曲线在前2×10³s中迅速下降,然后在−1.023VSCE处保持稳定直到结束。ZnLi合金的OCP曲线呈相反的趋势。合金的OCP值在浸没阶段3×10³s迅速增加,随后减小。在这里,OCP值的范围(ΔVSCE),可以由ΔVSCE=Vmax-Vmin计算,其中Vmin和Vmax分别为最小OCP值和最大OCP值。ΔV值如图5b所示,其中绘制了Zn的-ΔVSCE,以标明Zn的OCP值随时间递减,与ZnLi合金相反。ZnLi合金的ΔVSCE值随着Li含量的增加而增加到0.8%Li,然后在0.16VSCE左右保持稳定。
对这些材料进行了PDP测试,比较了锌和ZnLi合金的耐腐蚀性。图5c中阳极和阴极塔菲尔斜率都随Li含量而变化,表明Li影响锌基质的溶解和耗氧量。锌、Zn-(0.1-0.2)Li合金的PDP曲线形状相似(图5c)。然而,钝化区域从−1.15VSCE开始到−0.87VSCE出现在Zn-(0.5-1.4)Li合金的PDP曲线的阳极分支中,表明形成了一个含Li的被动膜。被动区域和膜的分解可能随着Li含量的增加而增加。图5c表明锂含量较高,对阳离子溶解的动力学屏障效应较高。锌的Ecorr值(−1.01VSCE)在所有材料中都是最高的,与锌的标准电极电位一致。对于ZneLi合金,Ecorr值随着Li含量的增加而增加。除Zn-0.1Li合金外,这些合金的icorr 均低于锌。对于Zn(0.2-1.4)Li合金,icorr 随着Li含量的增加而减小。
Fig. 5 portrays the OCP and PDP curves corresponding to Zn and ZnLi alloys tested in SBF. As shown in Fig. 5a, typical OCP curve of Zn exhibits a rapidly decline in the first 2 × 10³ s, and then keeps stable at −1.023 VSCE till the end. A reverse trend is found in OCP curves for the ZnLi alloys. The OCP values of the alloys increase rapidly at the initial immersion stage within 3 × 10³ s, which decrease afterwards. Here, the range of OCP values (ΔVSCE) can be calculated by ΔVSCE = Vmax-Vmin, where Vmin and Vmax are the minimum and the maximum OCP values, respectively. The ΔV values are given in Fig. 5b, in which -ΔVSCE of Zn is drawn in order to emphasis that the OCP values of Zn decreasing with time, opposite to the ZnLi alloys. It is clear that ΔVSCE values of the ZnLi alloys increase with Li content until 0.8% Li, and then become stable at about 0.16 VSCE.
PDP testing on the materials is conducted to compare the corrosion resistances among Zn and ZneLi alloys (Fig. 5c). Both anodic and cathodic Tafel slopes change with Li content, indicating that Li affects dissolution of the Zn matrix and oxygen consumption. PDP curve shapes of Zn, Zn-(0.1–0.2)Li alloys are similar (Fig. 5c). However, passivation zones ranging from appr. −1.15 VSCE to −0.87 VSCE appear in anodic branches of the PDP curves of Zn-(0.5-1.4)Li alloys, indicating formation of a Li-containing passive film.The passive area and the film break down potential increase with Li content (Fig. 5c), indicating a higher kinetic barrier effect on anodic dissolution with higher Li content. Ecorr value of Zn (−1.01 VSCE) is the highest among all the materials, consistent with the standard electrode potential of Zn. For the ZneLi alloys, Ecorr values increase with Li content. Except Zn-0.1Li alloy, icorr values of the alloys are lower than that of Zn. For Zn-(0.2-1.4)Li alloys, icorr value decreases with Li content.